.png)

Amazon Advertising Stats for 2022
Today, Amazon is an advertising giant–even outpacing Google and Facebook in growth over the last three years. As such, it’s important to stay up-to-date with the latest advertising statistics and trends on the platform. By analysing this information, you can make data-driven decisions; identify new opportunities; and benchmark your business against competitors on Amazon. It’s a good idea to compare your business within the same market and time periods, to gain a more informed understanding of the landscape online.
In 2019, Amazon Marketplace had 225,000 sellers globally with profits over USD $100,000. Undoubtedly, this number will have increased in 2022. To capitalise on this, Amazon sellers need to optimise their ads by looking at the data.
Average Amazon Daily Impressions
“Impressions” refer to the number of times your business’ ad is displayed: regardless of whether it was clicked or not. In 2021, over 2.14 billion people worldwide were expected to buy goods and services online, up from 1.66 billion global digital buyers in 2016. In the US alone, Amazon has 148.6 million Amazon Prime members; making this the perfect opportunity for advertisers to reach new audiences.

Average Amazon Daily Spend
Daily advertising spending is a metric measuring the total cost invested in advertising. On Amazon, our clients are predominantly in the coffee, fashion, stationery, and electronics categories. Since January 2022, Luzern has supported the running of 951 campaigns for coffee products; 855 for fashion items, and 676 for stationery. Together, these campaigns contribute to the average daily spending on Amazon – which amounts to almost USD $40 billion in 2022.
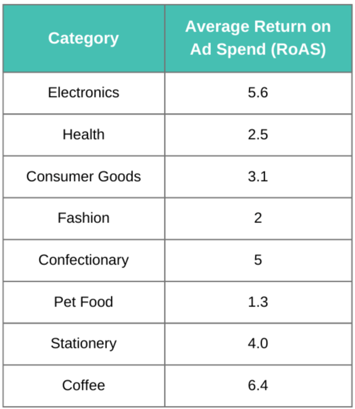
Average Amazon Daily Revenue
Revenue for Amazon advertisers will vary depending on product demand. Luzern’s clients are spread across a range of industries and categories. As you’ll see below, this can affect Return on Ad Spend (RoAS) for better or for worse.
Average Amazon Seller CTR
Click-through rate (or CTR) can be defined as the number of clicks your ad receives, divided by its number of impressions. Like all other benchmark statistics, CTR changes based on the category of a business’ products. Luzern eCommerce data shows, for example, that CTR can range from 0.26% (for animal food) to as high as 0.43% (for confectionary products). The below CTR statistics are averages, for each of our clients’ categories on Amazon.
-1.png?width=353&height=410&name=Category%20(1)-1.png)
Average Amazon Seller CPC
As Amazon advertising grows in popularity, so does the average cost-per-click (CPC). This is because an increased number of brands are competing for the attention of audiences. According to Luzern data for 2022, culinary items have the lowest CPC at USD $0.25. The highest CPC was for the health category, which averaged a cost-per-click of USD $1.29. Below, you’ll find our full breakdown of CPC per category.
-1.png?width=359&height=410&name=Category%20(2)-1.png)
Average Amazon Seller CVR
Amazon’s conversion rate is as high as 10-15%: while this varies from category to category, your business should aim for a CVR within this range. To calculate the conversion rate for your business, simply divide your total number of orders by the total number of ad clicks.
Average Amazon Seller ACOS
Advertising Cost of Sales (ACoS) is a metric used to calculate the amount you need to spend, in order to generate one dollar of revenue. This depends greatly on the category, with culinary products by far the highest for ACoS.
-1.png?width=354&height=410&name=Category%20(3)-1.png)
FAQ
How can I maximise spending on Amazon?
If you’d like to maximise ROI for your business’ ad spend, you may want to consider outsourcing your performance marketing. Our guide to Amazon Advertising is a great starting point for business owners.
How does Amazon’s conversion rate compare to other eCommerce platforms?
Amazon has a much higher average conversion rate, compared to other platforms like Google and Facebook. This is because Amazon’s global audience has high purchase intent: often already knowing what they’d like to buy.

Source: Marketplace Pulse
Why is CPC so high on Amazon?
Following the pandemic, there was an increase in sellers on Amazon. As a result, CPC has risen–with sponsored product results accounting for most ad expenses on the platform. More businesses are bidding on ad space, which brings up the average price for everyone.
Luzern allows you to optimise your ad spend. Learn more below!
How Luzern eCommerce Can Boost Your Brand’s Amazon Ads
Whether it’s Prime Day or Black Friday/Cyber Monday, there are many opportunities to appear in front of customers on Amazon. With a trusted hybrid 1P/3P selling partner, you can overcome your challenges by following an advertising strategy, tailored to your goals.
Luzern eCommerce ranks within the top 1% of third party sellers on Amazon Marketplace. To start growing your revenue, speak to our experts today.
Want to find out more?

So What’s next?